Explore the alt season crypto opportunity and learn how to maximize your investments in cryptocurrency as Altcoins retest breakouts.
While the world is worried about a stock market crash, smart money is buying breakout retests on popular altcoins, possibly the last cheap crypto opportunity.
Red days in the markets usually scare people, and retail money stays sidelined until it’s green again. But that means that they are getting less return on their dollar – as the age-old saying goes, ‘buy the fear’.
Last week, we saw many altcoins breakout of rectangle formations or remain rangebound in relatively long consolidation periods. But this week, Bitcoin’s price
.cwp-coin-chart svg path {
stroke: ;
stroke-width: ;
}
Price
Trading volume in 24h
<!–
?
–>
Last 7d price movement
is undergoing a correction, which triggered a market-wide sell-off. For sidelined people, such corrections are the best opportunity to buy.
How Are Altcoin Breakouts Performing Against the Bitcoin Price Dip?
Building on last week’s analysis, we will revisit the coins analyzed last week when we explained rectangle trading and re-examine retest levels of/near upper levels for leading altcoins.
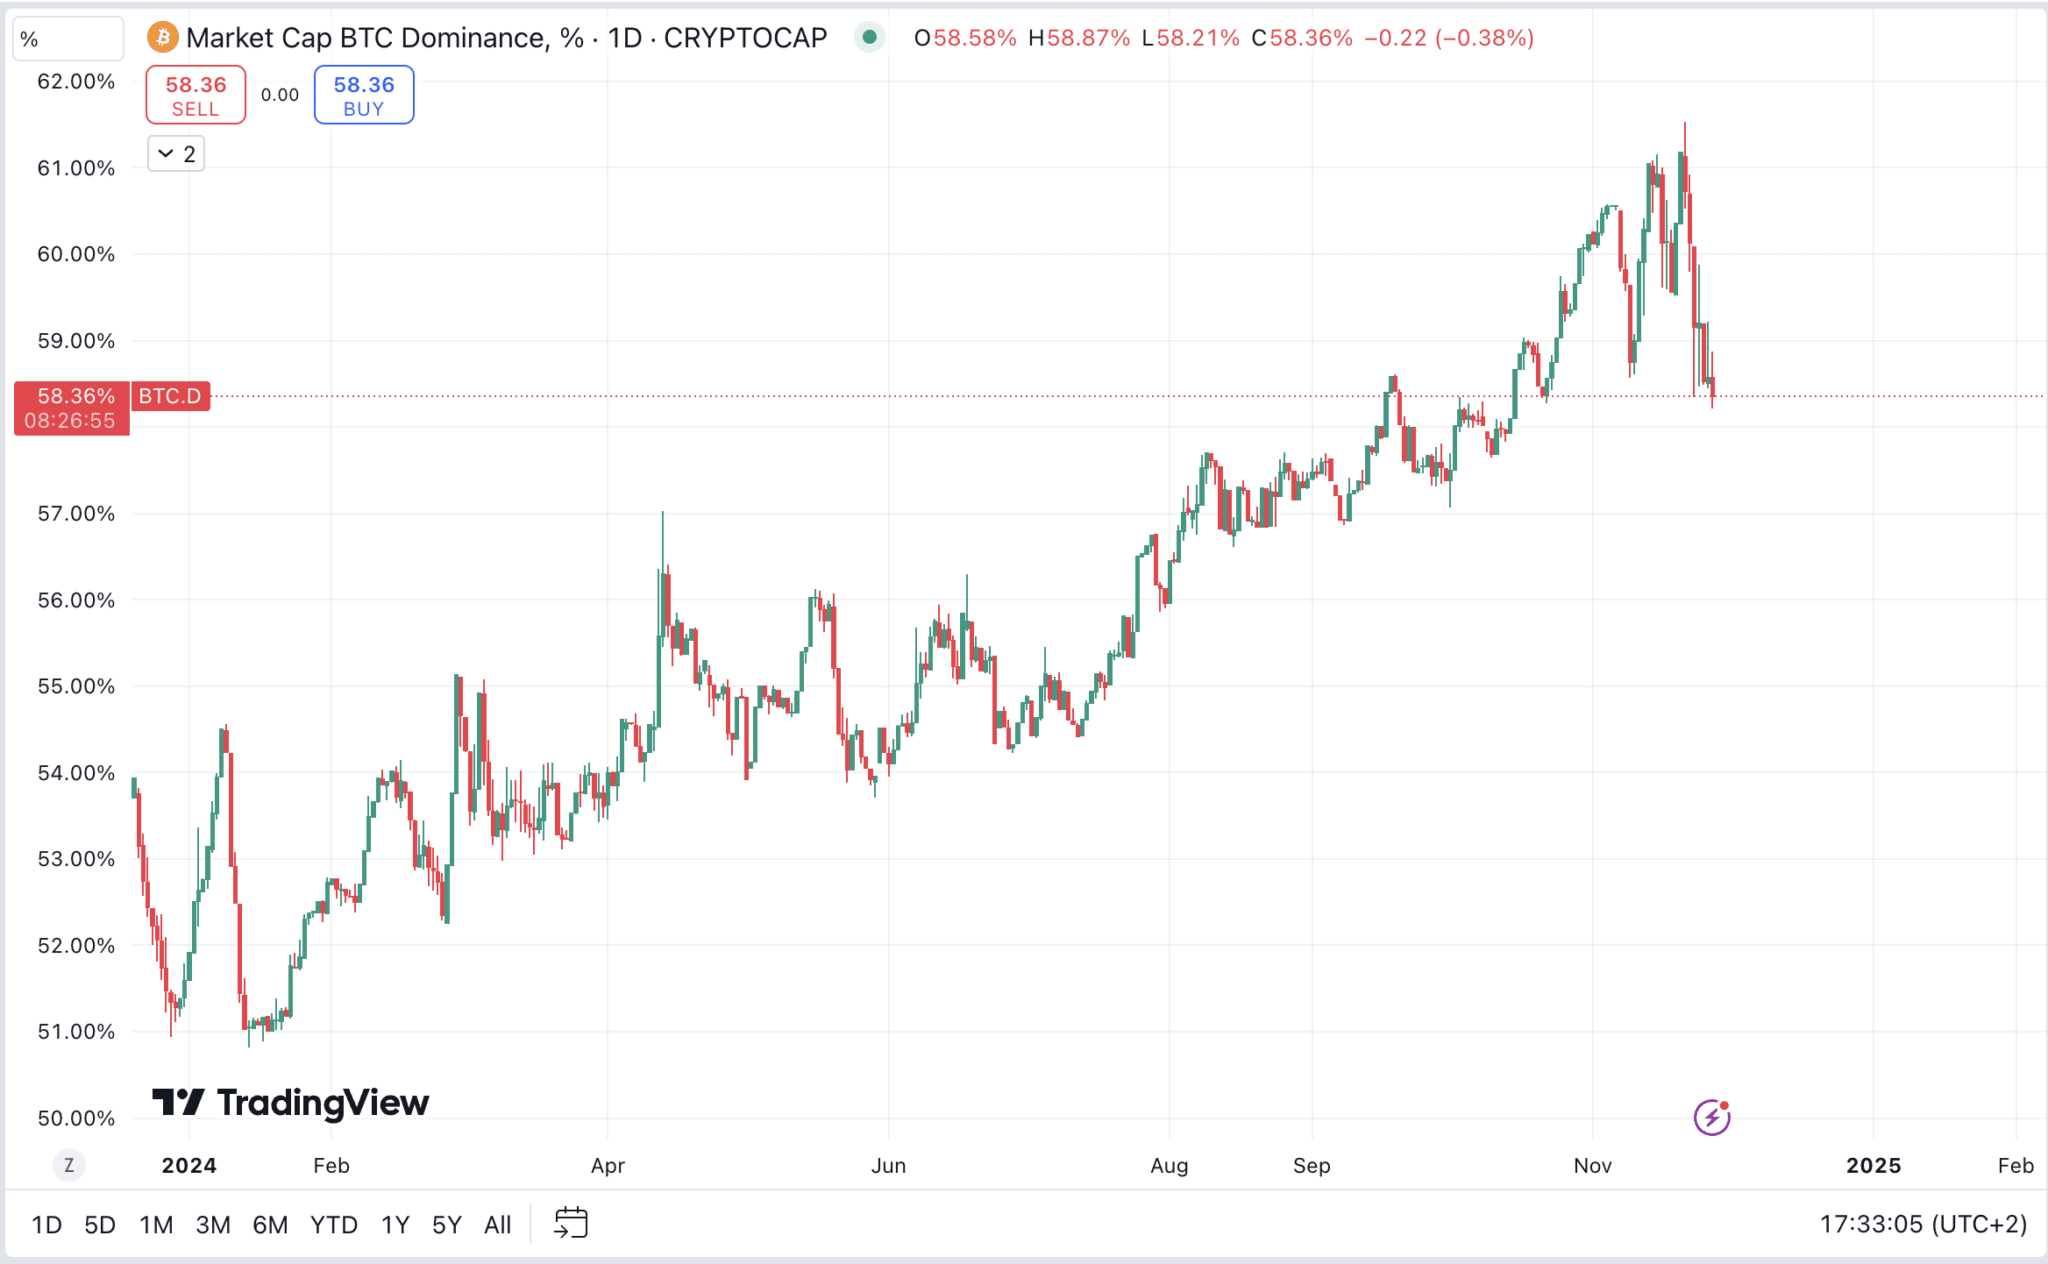
First, we want to look at Bitcoin’s Dominance chart, which has plummeted in the past few days following Bitcoin’s over-heating at $99.3k. 
(BTC.D)
And this is exactly what we are looking for – the uptrend of this chart is being broken as Bitcoin price declines relative to the altcoin market.
I should note this does not mean that Bitcoin’s price is not going to grow; it probably will push into the 6 figures over the coming months.
But it indicates that more money has flown into altcoins in the last few days, suggesting the emergence of an alt-season trend.

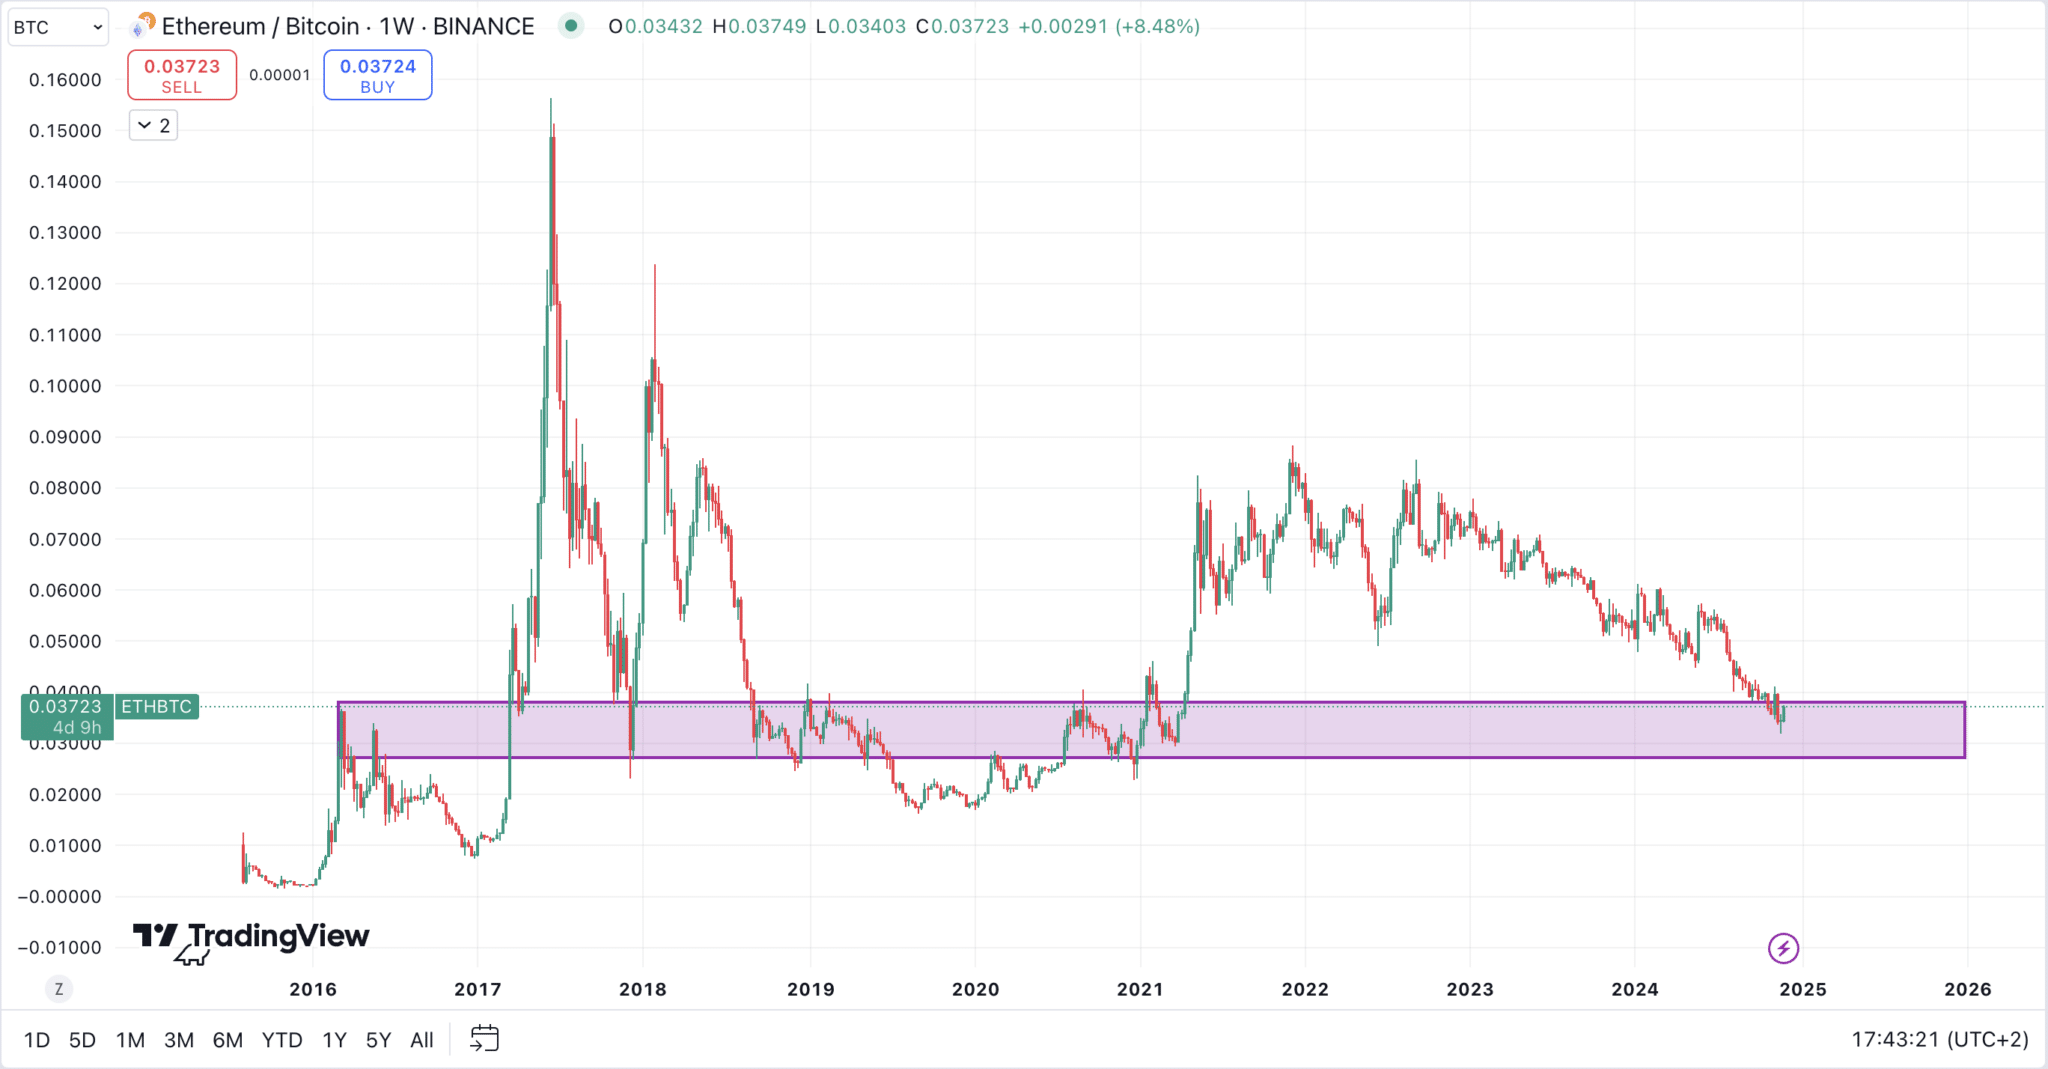
(ETH/BTC)
Next, we look at the ETH/BTC chart, and we can see that the price or ratio has returned and is retesting an area of interest. This has been an indicator for previous altcoin runs. We shall see if history repeats for the current bull run.
In addition to that, at the moment of writing, Ethereum’s price
.cwp-coin-chart svg path {
stroke: ;
stroke-width: ;
}
Price
Trading volume in 24h
<!–
?
–>
Last 7d price movement
has grown 7% today!

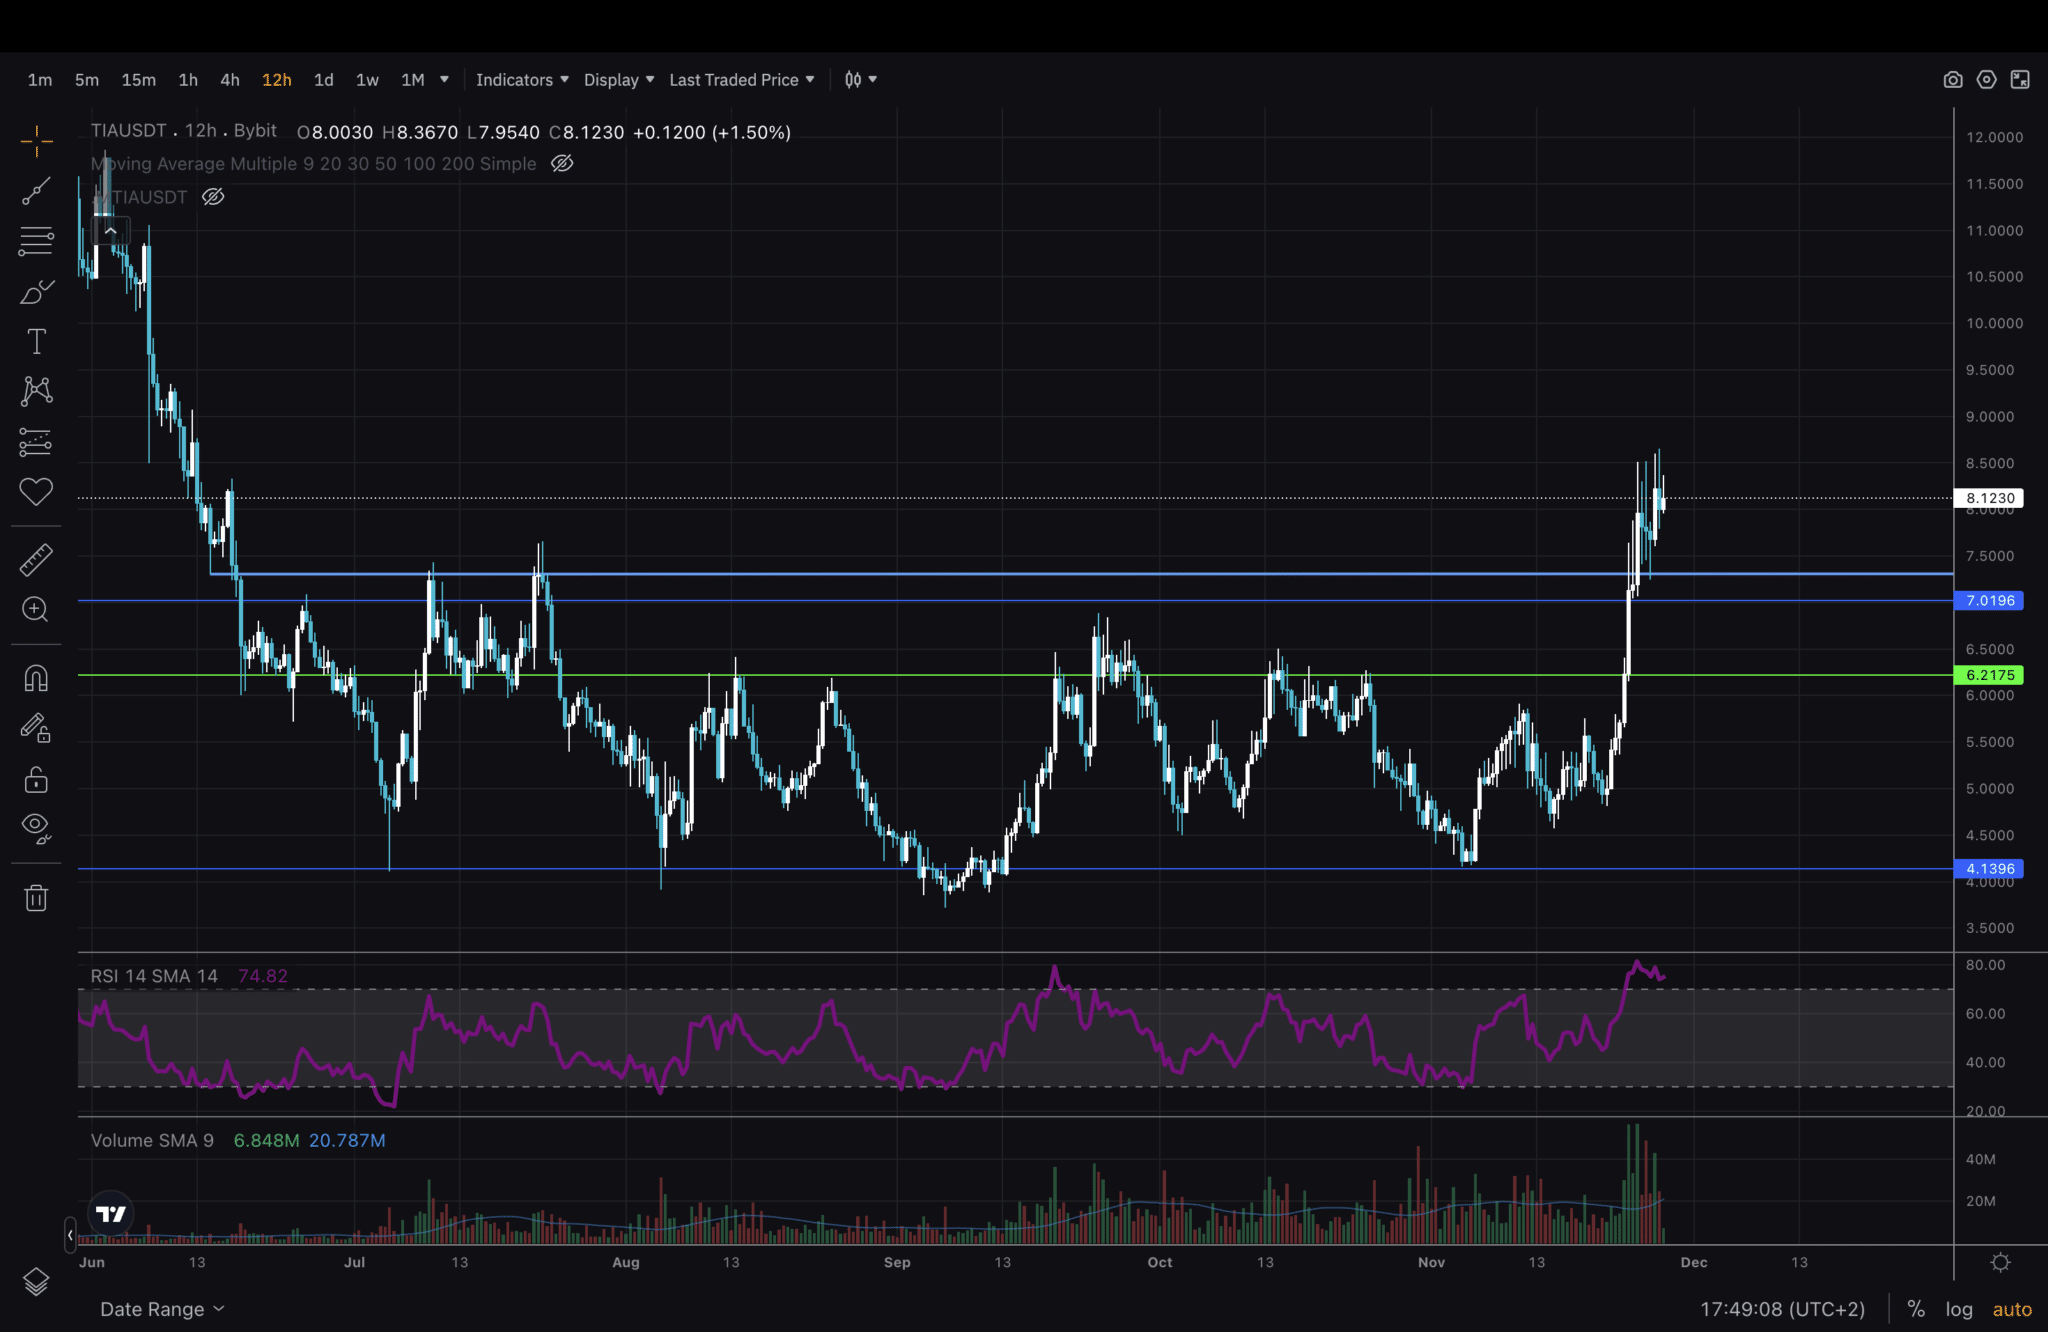
(TIA/USDT)
As an example of a rectangle retest in technical analysis, we are looking at TIA
.cwp-coin-chart svg path {
stroke: ;
stroke-width: ;
}
Price
Trading volume in 24h
<!–
?
–>
Last 7d price movement
.
From last week’s article analysis, I have added one more level—the light blue, which only gets tapped twice in July.
Last week, the price pushed through without much hesitation. It could be that the only retest we will see is on that light blue line and front-run the orders set at the $7 level.
Go out and draw some lines. And remember to always use sound risk management!
EXPLORE: Crypto Crash Sends Shockwaves Through Market: Why Is Bitcoin Down and Is the Bull Run Over?
Join The 99Bitcoins News Discord Here For The Latest Market Updates
The post Crypto Opportunity: Fears Of US Stock Market Crash Could Provide Discounts For Buyers appeared first on .


