
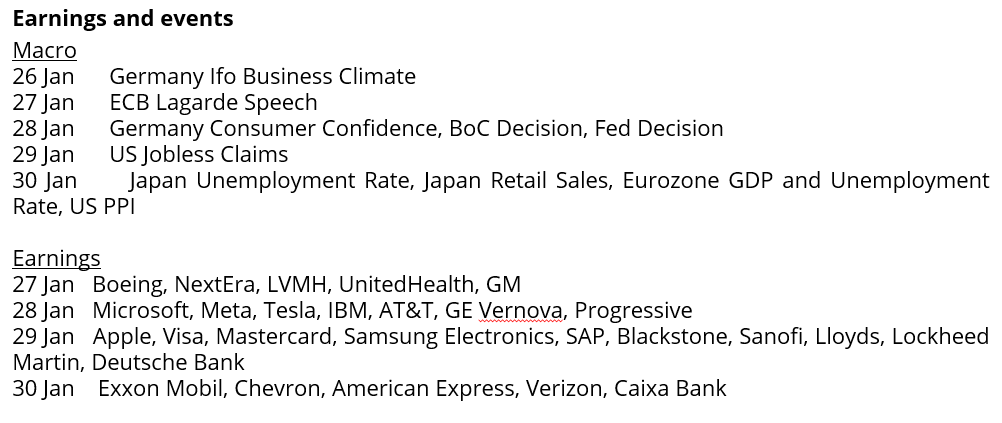
Analyst Weekly, January 26, 2026
This week brings a flood of high-impact earnings from megacaps and sector bellwethers across tech, semiconductors, healthcare, consumer, industrials, and energy. Markets are looking beyond headline beats or misses: the focus is squarely on pricing power, demand resilience, cost discipline, and how management teams are framing 2026. Below are the key earnings to watch and what’s likely to move each stock.
- Microsoft (MSFT). Focus: The stock’s reaction will hinge on Azure cloud growth and AI services.Investors are focused on cloud demand and margins: Microsoft’s AI-driven revenue backlog (including major OpenAI and Anthropic commitments) is huge, so any update on cloud growth rates, AI monetization, or guidance will be key. Market Reaction Drivers: Strong Azure and AI results (or a guidance surprise) could reinforce the view that Microsoft’s hefty AI investments are paying off, while any sign of cloud deceleration might raise valuation worries.
- Meta Platforms (META). Focus: Meta’s earnings are highly anticipated as a gauge of digital ad health. The key stock driver will be whether Meta can sustain strong advertising growth and show expense discipline. Investors’ focus areas include ad trends, the outlook for 2026 expenses, and the ongoing Reality Labs losses. Market Reaction Drivers: Meta has started reining in its metaverse ambitions after Reality Labs’ cumulative losses topped $70B. Any updates on cost cuts there, alongside commentary on user engagement or new monetization (like ads on Threads), will heavily influence sentiment.
- Apple (AAPL). Focus: On the earnings call, investors will listen for updates on its AI partnership and guidance on margins, as well as any hints about new products (AR/VR devices or a foldable iPhone) and how Apple plans to navigate trade headwinds in 2026. Market Reaction Drivers: iPhone sales and services growth are expected to drive double-digit revenue and EPS gains, but the main catalyst may be Apple’s emerging AI strategy. In fact, Apple just struck a multi-year deal to use Google’s Gemini AI models to power Siri and future products: a move analysts say finally addresses the “invisible AI” gap in Cupertino’s strategy.
- Tesla (TSLA). Focus: The biggest driver of Tesla’s stock reaction will be automotive profit margins, which have been squeezed to multi-year lows by price wars. Investors are hoping to see signs that gross margins have stabilized or that Tesla’s energy storage business (which now enjoys higher margins than autos) can offset weakness. Market Reaction Drivers: Tesla’s commentary on order backlogs in China/Europe, the uptake of its FSD (self-driving) subscriptions, and progress on the robotaxi fleet or Optimus humanoid robot will be closely scrutinized. Any positive surprises, better-than-expected margins or concrete timelines for these projects, could swing the volatile stock.
- Boeing (BA). Focus: Boeing reports after a strong run: the stock jumped ~23% in 2025 on hopes of an aviation upcycle. The company finally returned to positive earnings and expects a ~46% YoY revenue jump in Q4 as deliveries hit their highest since 2018. Market Reaction Drivers: Investors are looking for Boeing to confirm higher jet production rates and improving cash generation. Free cash flow guidance for 2026 will be critical as well: if the company signals cash flows will significantly rise next year, it would validate the bullish case. Conversely, any hiccups in hitting those production targets or cautious commentary on supply-chain risks could temper the enthusiasm around Boeing’s recovery.
- ASML Holding (ASML). Focus: ASML reports on 28 January, and the focus will not only be on profits, but also on orders. Strong demand from TSMC and memory makers like Samsung could signal a powerful setup for growth into 2027, even if 2026 looks constrained. Market Reaction Drivers: Investors will watch whether Q4 orders land around €7bn and how management frames 2026 guidance. Commentary on the trajectory of China-related sales, now expected to decline under export controls, will also matter. If ASML signals that other regions are ramping fast enough to offset this, it could ease geopolitical overhangs. Even if near-term revenue growth looks modest, strong orders would reinforce confidence that ASML’s AI- and memory-driven cycle still has plenty of runway.
- Visa (V) & Mastercard (MA). Focus: Visa and Mastercard report on 28 January, with the focus on consumer spending trends, cross-border volumes and management commentary rather than headline earnings beats. Stable card usage and resilient travel demand would support confidence in continued low-double-digit revenue growth, despite elevated regulatory noise. Market Reaction Drivers: For Visa, investors will watch spend indicators and commentary on incentives and pricing, while Mastercard’s initial framing of 2026 guidance and services momentum will be key. Even largely in-line results could help stabilise sentiment if both companies reassure markets that volumes remain healthy and regulatory risks are manageable.
- Exxon Mobil (XOM). Focus. In 2025, oil prices fell almost 20%; Brent averaged in the low $60s which will drag on Exxon’s Q4 earnings. Exxon has already warned that lower crude prices likely cut its upstream profit by up to $1.2 billion versus Q3, though stronger refining margins may offset a few hundred million. Market Reaction Drivers: Investors will look for confidence that volume growth and cost cuts can drive robust cash flow even at lower oil prices. Key focus areas include Exxon’s 2026 capital spending plans, any updates to its recently raised 2030 profit outlook (Exxon boosted its long-term earnings/cash flow targets without higher capex), and how it will deploy its “surplus” cash (dividends, buybacks). If Exxon underscores its resilience and guides to solid cash generation at $60 to $70 oil, it could uplift the whole energy sector.
Gold Is Replacing Bonds as the Preferred Hedge
Gold is increasingly being used by investors as a hedge against equity risk, displacing long-duration Treasuries. The shift reflects a structural breakdown in the traditional equity-bond relationship: since 2022, correlations have hovered near zero, eroding bonds’ effectiveness as a diversifier.
Historically, duration exposure cushioned drawdowns in risk assets. But recent episodes, like the post-Liberation Day drawdown where equities and long bonds sold off in tandem, have undermined confidence in bonds as a reliable hedge.
Investment Takeaway: Gold has held up as a defensive asset. Flows show investors allocating to equities and gold simultaneously, while reducing exposure to longer-dated bonds. The trend reflects more than inflation hedging and a reallocation of portfolio risk management. If the bond-equity correlation remains unstable, the role of gold as a volatility dampener could become more entrenched, redefining how portfolios hedge downside risk over the cycle.
Netflix Stock After a Turbulent Week: Sell-Off Halted – What’s Next?
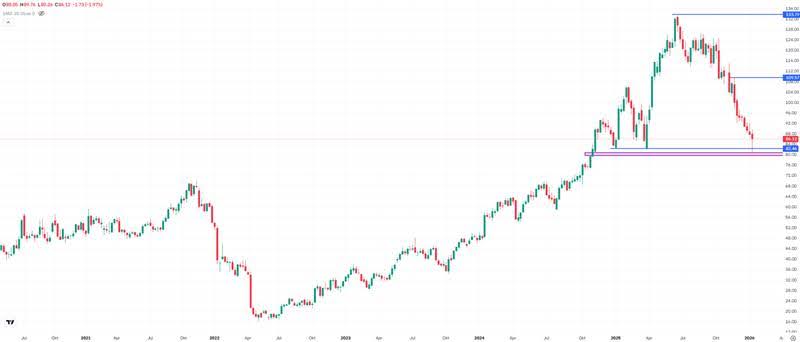
Netflix shares experienced a highly volatile week. Selling pressure initially accelerated. While the quarterly results were solid, the outlook was perceived as more cautious. At its low, the stock fell by nearly 9% to $80.26.
Later in the week, a rebound set in, limiting the weekly loss to around 2%. Netflix ended the week at $86.12. The brief drop also resulted in a false breakdown below the January and April 2025 lows.
At the same time, an important support zone (fair value gap) between $79.72 and $80.81 was successfully defended. Fair value gaps represent market inefficiencies. The long lower wick on the weekly candle, combined with the defense of this zone, points to a potential stabilization.
In the coming weeks, investors should watch for further confirmation signals, such as a sequence of higher highs and higher lows, which could indicate the formation of a new uptrend. The stock is currently trading about 36% below its all-time high.
Netflix, weekly chart. Source: eToro
Meta Stock at Resistance: Earnings as the Key Catalyst
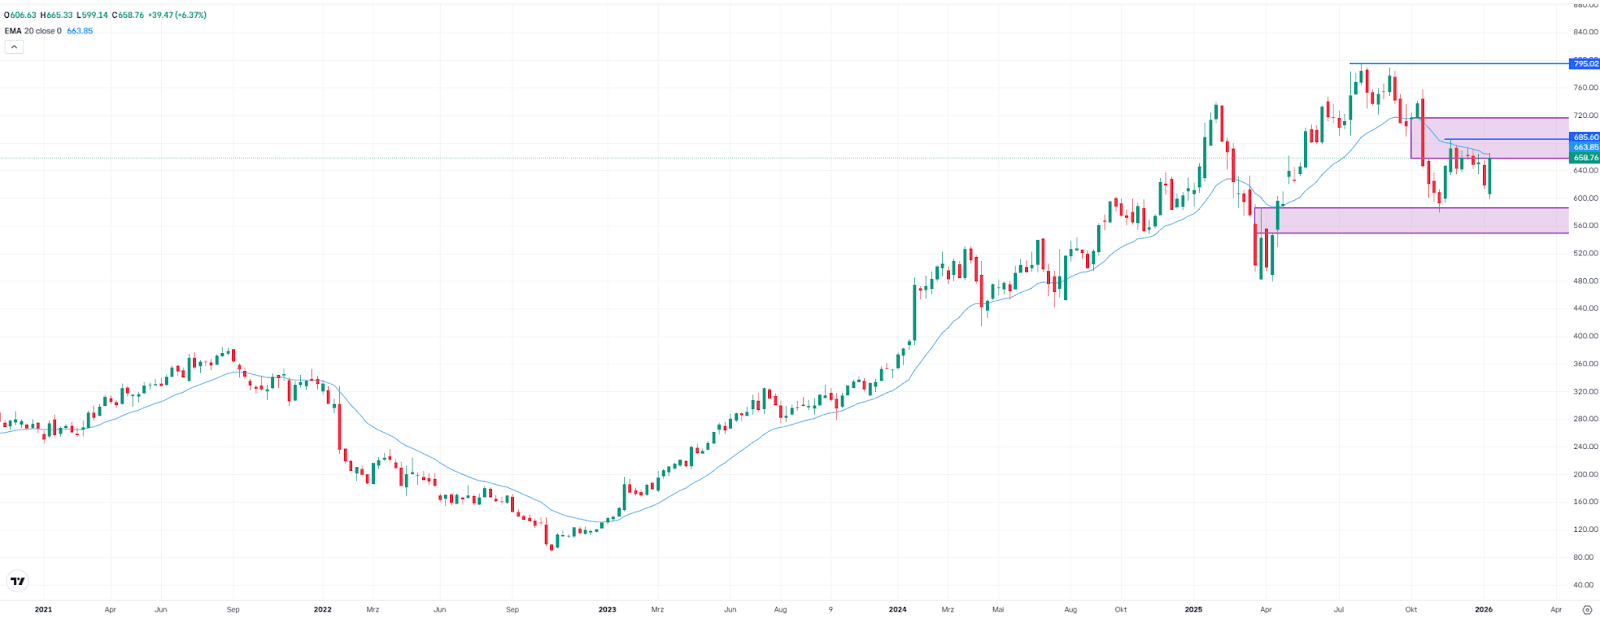
Meta shares gained 6.4% last week, closing at $658.76. This move has pushed the stock into a well-known resistance zone (fair value gap) between $658.13 and $715.30. An area where buyers have been rejected multiple times since early December.
The key short-term catalyst is earnings on Wednesday evening. A sustained move above the 20-week moving average at $663.85 would be a first positive signal. A breakout above the intermediate high at $685.75 would further improve the technical picture.
In that scenario, the probability increases that the stock could retest its all-time high at $795. For context, Meta had declined by around 27% between August and November, and that gap has now been reduced to roughly 17%.
On the downside, a strong support zone (fair value gap) between $548.90 and $588.72 has so far prevented deeper pullbacks. Should a short-term retracement occur, this area could once again act as a support zone.
 Meta, weekly chart. Source: eToro
Emerging Markets: Fifth Weekly Gain in a Row – How Sustainable Is the Rally?
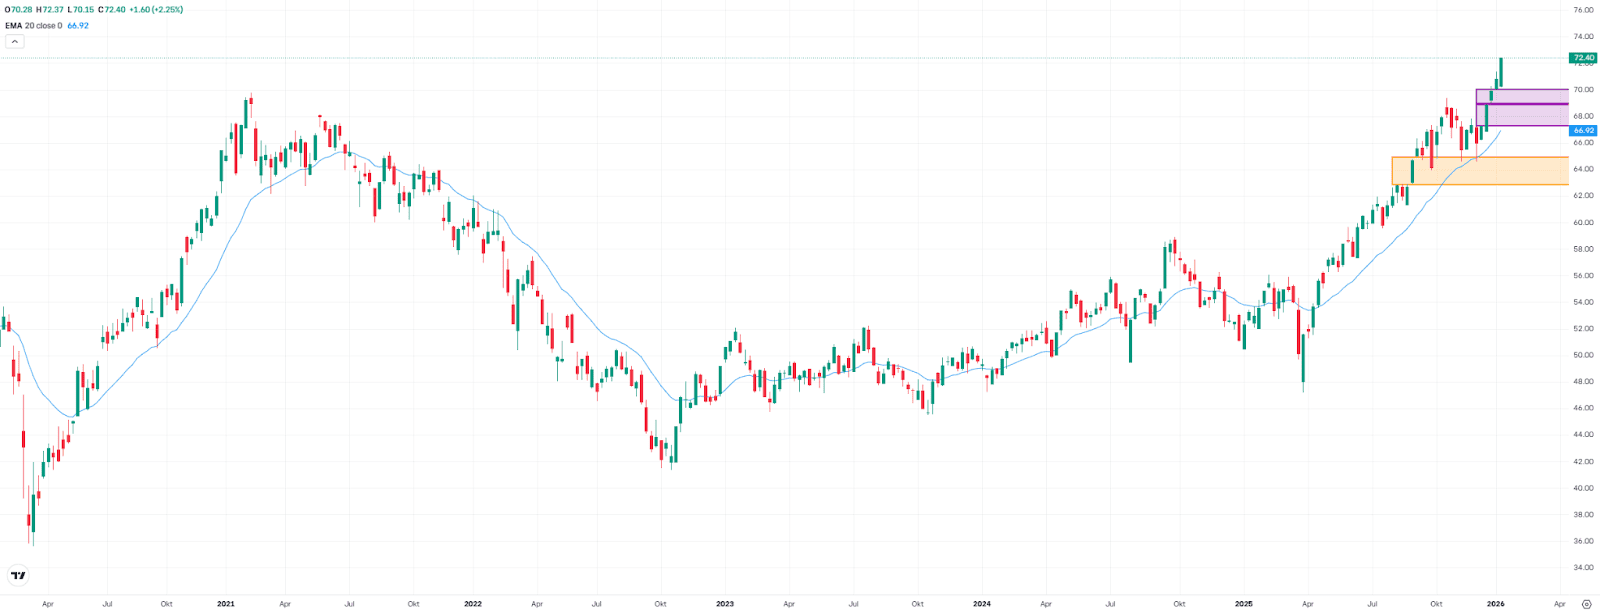
The iShares Core MSCI Emerging Markets ETF rose by 2.3% last week, reaching a new record high and marking its fifth consecutive week of gains. Recently, a rotation of capital away from US assets toward Asia and emerging markets has been observed. The upward momentum that began in mid-December is now well advanced.
However, the rapid price increase has created new fair value gaps at $68.90–$70.04 and $67.28–$69.01. Fair value gaps represent market inefficiencies and are often revisited by price at a later stage (see the previous example highlighted in orange on the chart from September to December).
These areas can therefore serve as potential areas of interest for buyers. What matters most, however, is the market’s reaction. The zone should not only be reached but also respected. Only with confirmation, such as stabilization or clear reversal signals, do the chances of a successful entry improve.
 IEMG, weekly chart. Source: eToro
Bitcoin: Fragile Equilibrium
Bitcoin enters the end of January in a phase of fragile equilibrium, defined more by flows and positioning than by narrative. Price remains stable in the USD 88,000–91,000 range, but recent movements make it clear that the market is not being guided by a structural thesis, but by macro impulses and tactical capital reacting to headlines.
The latest episode illustrated this well. It was not a crypto catalyst that moved the market, but politics. The cooling of tariff rhetoric triggered a broad rebound in risk assets. Bitcoin did not lead or decouple, but it followed. The move was also amplified by leverage and resulted in a liquidation event, rather than a clean entry of buyers.
This reinforces a familiar reading: bitcoin continues to behave like a risk asset, not a safe haven. When uncertainty eases, it holds up; when it intensifies, it fails to attract defensive flows, unlike gold.
Beneath the surface, on-chain data adds important nuance. The market shows cooling, not weakness. Network activity has moderated, net flows to exchanges remain negative, and a growing share of supply remains immobilized in the hands of long-term holders. Profit-taking has fallen significantly compared to the fourth quarter of 2025. Put simply, less is being sold and more is being accumulated, albeit without urgency. Structural selling pressure is low, but that does not imply immediate upside momentum.
In derivatives, the use of leverage has increased again, but in a contained manner. Open interest has recovered after the cleanup of positions at the end of 2025, with a predominance of long positions and still-moderate funding costs. There are no clear signs of overheating, although a rise in funding above 5% would increase the risk of downside liquidations. The market has room to build positions, but it is not “forced” in any direction.
The options market reinforces this balanced reading. The “Max Pain” level sits very close to the spot price, which tends to compress short-term volatility. Skew is starting to turn higher, with increased interest in calls above USD 95,000–100,000, while puts at lower strikes continue to be used as institutional hedges. There is no panic, but there is caution.
As for participants, the pattern is clear. Demand comes mainly from institutions, ETFs, and large holders, with sustained accumulation flows. Retail investors are neither present nor expected. Sellers are primarily medium-term holders who continue to take profits gradually, with no signs of capitulation. Miners and large whales are reducing sales. The net balance favors structural buyers.
All of this is happening at a time when the old map no longer works. The four-year cycle no longer explains market behavior on its own. Liquidity has concentrated in institutional vehicles that do not rotate into the rest of the ecosystem as they once did, resulting in a narrower, more demanding, and slower market. Meanwhile, infrastructure continues to advance (tokenization, stablecoins, 24/7 trading), and utility is progressing faster than price.
As things stand, bitcoin is not broken, but it is not confirming a clear direction either. It is neither in a breakout phase nor in euphoria. Support is being built through quiet accumulation, not exuberance. As long as institutional flows continue and leverage remains controlled, the current range makes sense.
The bullish catalyst remains the persistence of ETF inflows; the main risk is a rise in leverage combined with macro shocks. The market does not need more narrative. It needs signals that can withstand stress.
This communication is for information and education purposes only and should not be taken as investment advice, a personal recommendation, or an offer of, or solicitation to buy or sell, any financial instruments. This material has been prepared without taking into account any particular recipient’s investment objectives or financial situation and has not been prepared in accordance with the legal and regulatory requirements to promote independent research. Any references to past or future performance of a financial instrument, index or a packaged investment product are not, and should not be taken as, a reliable indicator of future results. eToro makes no representation and assumes no liability as to the accuracy or completeness of the content of this publication.


