
Bitcoin fluctuated between $92,000 and $100,000 through late December before reclaiming $102,000 by Jan. 6. CryptoQuant data suggests that reduced sell-side liquidity, changes in over-the-counter (OTC) desk balances, and a renewed whale accumulation pattern might be factors shaping these fluctuations.
OTC Desk balances decline
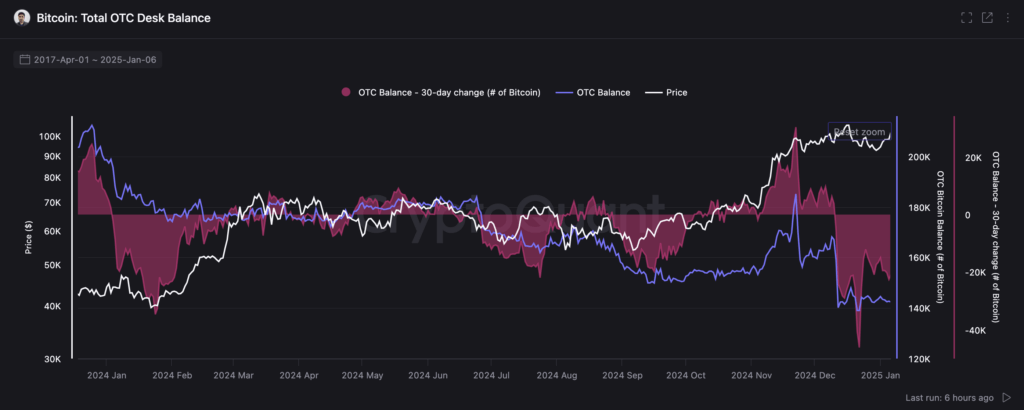
Activity on OTC desks, tracked through total holdings and 30-day balance changes, reveals declining balances at the end of 2024 after rising from October to December. Net outflows from these desks have appeared alongside a rising price environment, prompting discussions that large entities could be withdrawing coins from OTC channels and holding them off-exchange.
Per CryptoQuant, the pink overlay in the OTC chart below reflects a negative 30-day change, indicating more BTC outflow than inflow, while the blue line measuring the overall OTC desk balance shows a steady decrease. Analysts watch this dynamic because it frequently coincides with institutional or high-volume buyers removing coins from immediate circulation, often moving into spot Bitcoin ETFs.
Whales accumulate Bitcoin
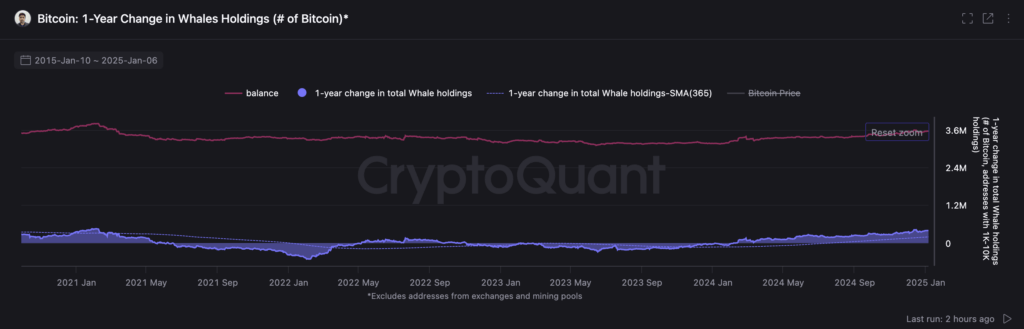
Further insights emerge from whale behavior. Addresses with 1,000 to 10,000 BTC displayed prolonged net selling from 2021 to 2023, yet 2024 data showed a shift toward neutral to slightly positive accumulation, highlighted in one-year change metrics.
These addresses had been distributing over a multi-year period, but more recent data points to a reversal. Until 2024, the pink line representing total whale holdings had plateaued at lower levels and then moved slightly higher, while the blue line measuring 1-year change began inching closer to zero. Since January 2024, both the whale balance and 1-year change have moved positive. This suggests that, at least in the aggregate, whales have reduced distribution and are possibly reacquiring coins after the halving and subsequent volatility.
Sell-side liquidity declines
The liquidity inventory ratio and total sell-side liquidity measures add further context. The CryptoQuant visualization below shows a downward trend in the overall liquid supply, suggesting fewer BTC reside in wallets known to engage in regular selling.
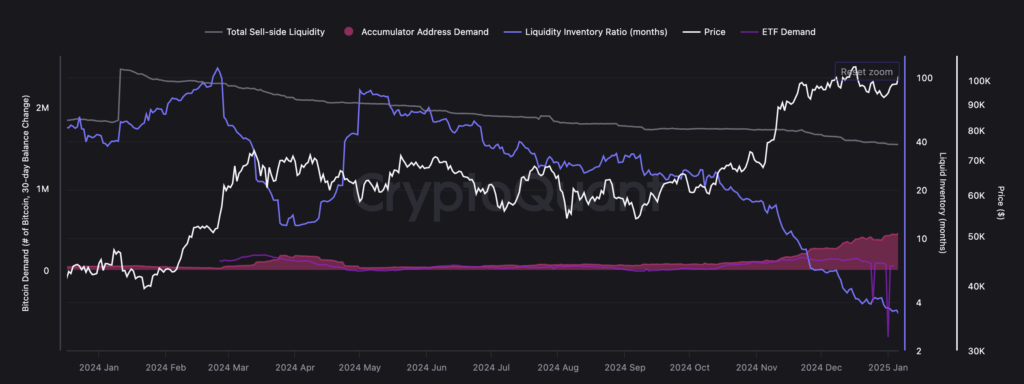
The liquidity ratio, often expressed in months, compares available BTC in liquid addresses to ongoing demand, and a falling ratio indicates that new demand could more quickly outstrip accessible supply. Meanwhile, the accumulator address demand metric shows incremental inflows to addresses known for long-term holding. These inflows have steadily increased since November 2024 rather than spiking dramatically. That pattern may represent a steady but not explosive wave of “buy-and-hold” behavior, which can tighten market conditions combined with falling liquid supply.
Sell-side liquidity in detail
The aggregated data below tracks this changing distribution of BTC across major categories: U.S. exchanges, OTC desks, miner holdings, and coins seized by government entities. Per CryptoQuant, the total number of BTC on U.S. exchanges dropped from peaks above two million in 2021 to around 1.39 million today. The last time this figure was this low was in March 2018.
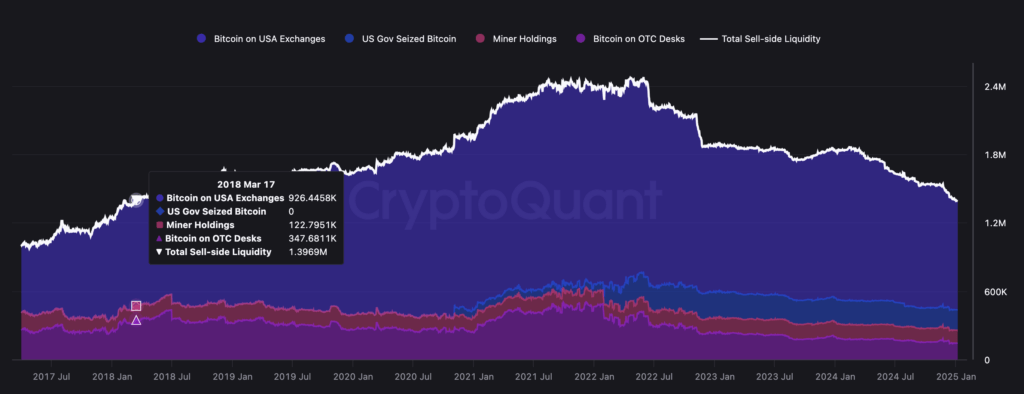
This decline generally aligns with broader industry trends showing reduced exchange balances, possibly influenced by rising awareness of self-custody and institutional strategies that favor off-exchange storage. The OTC portion, while smaller, echoes the downward pattern seen in standalone OTC charts, stressing the possibility that large buyers have migrated coins away from easily accessible pools of liquidity.
Miner holdings have shown limited volatility, though occasional shifts in their balance can signal the impact of operational costs or broader market pressures. These fluctuations did not overshadow the drop in total sell-side liquidity, which had stood in the multi-million coin range before declining as participants moved assets to private wallets. Government-held BTC, which occasionally emerges from auctions of seized coins, remains a small component of the total supply but is tracked by on-chain analysts who note periodic spikes in that metric tied to large-scale legal actions.
Bitcoin price history in 2024
Bitcoin’s price history through late 2024 into early 2025 provides a backdrop for interpreting these on-chain observations. It rallied from around $93,400 on Nov. 13 to repeated all-time highs in December, breaking $100,000 on Dec. 5 and reaching $108,300 on Dec. 17. The subsequent pullback to about $93,000 on Dec. 20 did not erase the broader uptrend, and each rally brought supply conditions back into focus.
As CryptoQuant data shows, the interplay of exchange balance declines, OTC desk outflows, and whale accumulation suggests that supply pressure remains a key influence on market structure. Traders have pointed to the steady demand from accumulators, moderate miner selling, and reduced exchange reserves as evidence that the float of available coins continues to shrink.
Observers note that these developments followed the April 2024 halving, which reduced block rewards to 3.125 BTC every ten minutes, adding another dimension to supply constraints. By November 2024, the U.S. presidential election result coincided with a swift price surge that saw Bitcoin approach $100,000, a psychologically significant threshold.
Bitcoin remains near six figures, with on-chain data suggesting that the circulating supply pool remains tight. The reaccumulation by larger holders, net outflows from OTC desks, and incremental additions to accumulator addresses converge to reinforce the notion that circulating BTC may be less plentiful than in previous cycles.
The post Bitcoin sell-side liquidity hits lowest level since 2018 fueling BTC rally appeared first on CryptoSlate.


